mardi 12 juin 2012

HeatMap Profession ~ Parti des candidats aux élections législatives et contribution au khi-deux (suite)

Dans le précédent post, nous avons déjà vu quelques notions permettant d'analyser le lien entre la profession exercée par les candidats aux élections législatives et leur appartenance politique.

Nous aurions pu compléter l'analyse des correspondances grâce à une petite heatmap montrant les effectifs et leur aspect significatif..

Plan:
  • La HeatMap
  • Calcul du khi-deux, explications
  • Les éléments-clé du code
  • Le code complet sous github


La heatmap


Dans cette heatmap, l'intensité de la couleur est relative à la valeur du khi-deux de la cellule (issue du couplage de deux modalités, Profession et Parti). Plus la valeur est élevée entre ces deux modalités et plus leur correspondance est élevée.

mercredi 6 juin 2012

Législatives 2012: Activité Professionnelle et Appartenance Politique

Ici, nulle géographie, nous allons exploiter les données du fichier des élections législatives. Il est téléchargeable à cette adresse:
http://www.data-publica.com/data/13587--liste-des-6603-candidats-aux-elections-legislatives-des-10-et-17-juin-2012

Ce fichier a déjà fait l'objet d'analyses sur des blogs:
Le fichier des élections législatives possède deux informations que nous allons utiliser spécifiquement ici: la profession du candidat et son affiliation à un parti, ceci afin de voir s'il existe un lien entre les deux.


Plan:
  • Tableau de contingence et visualisation
  • Classification hiérarchique
  • Analyse Factorielle des Correspondances

mardi 15 mai 2012

Résultats du second tour: Nature du vote et Distance au littoral

Article en français

French elections: nature of votes versus distance to the coast : In the previous post, we saw how to make a simple choropleth of votes. Here, I detail how to create a dataviz combining a map and a standard xy plot to visualize the relation that exists between the nature of votes and the distance to the coast. A good opportunity to use a very interesting R library: spatstat.


dimanche 13 mai 2012

Résultats du second tour: ma première choroplèthe avec R


 article en français

French elections - my first choropleth with R : Many journalists say that the electoral campaigns are becoming "data campaigns". The candidates are fighting, making massive use of numbers. They're looking for the number that will make the other one wrong. They're speaking numbers, displaying plots, graphics - interactive or not - about what the actual state of the country is, and how they intend to change it. Why not taking the most of the elections data to learn how to make a simple choropleth with R?

The entire code is available for download at the end of the article


Dans cet article, nous allons créer une petite choroplèthe des résultats du second tour des élections présidentielles.

dimanche 8 avril 2012

Le carroyage avec QGIS et le plugin QMarxan, c'est facile!

Article en français 

Gridding Paris with OpenStreetMap data
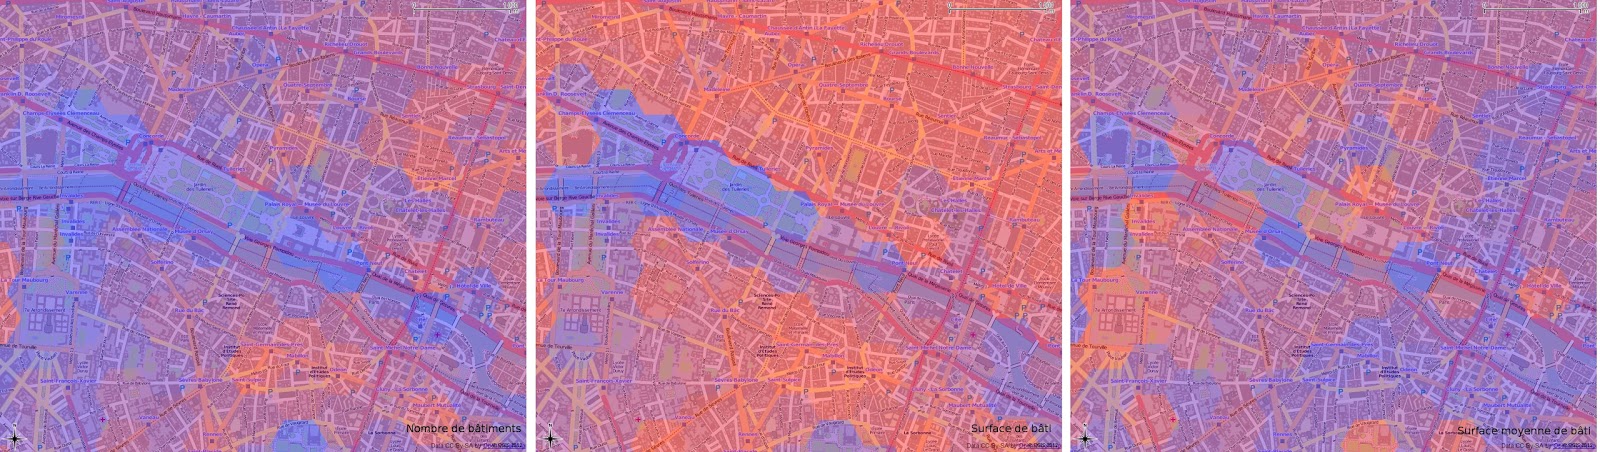
"Gridding for the dummies" ;) with Quantum GIS and QMarxan: In this article, I explain the purpose of gridding, why it is such an efficient way to analyse data within a large community of actors. Actually, gridding can be considered as a transcription of the raster format to the vector one where one tile <=> one cell. Thanks to QMarxan, gridding with QGIS is really simple:  you don't need any knowledge in PostGIS, GRASS and R to do it. That's what we'll see: in the end of the post, I detail how to constitute some gridded data through a case study aiming to process a building density analysis on the city of Paris. The article is in French, but the printscreens will be helpful for the understanding. 

All the material used in this article is free: Quantum GIS, OpenStreetMap for the buildings and INSEE (equivalent of US Census) for the population data.