Affichage des articles dont le libellé est QGIS. Afficher tous les articles

mardi 14 février 2017

Parcourir le Monde

Quel est l'itinéraire idéal pour parcourir le Monde ? Combien de temps de vol cela prendrait ? Quels sont les deux pays les plus distants l'un de l'autre ?
Dans ce post, j'ai fait mumuse avec la carte du globe, et appris des choses au sujet des distances orthodromiques et des voyageurs de commerce. Bon voyage !


jeudi 27 octobre 2016

Le sport en France métropolitaine et le leurre cartographique

Dans ce post, nous allons voir comment réaliser un leurre cartographique, soit la réalisation d'une carte représentant un territoire totalement façonné par des données. Plus précisément, nous verrons la conception d'un territoire de la pratique sportive par départements en France.&nbsp


lundi 4 avril 2016

Des statistiques et des bulles d'iris qui flottent sur Paris

Cet article traite des cartes avec camemberts, des problèmes que cela pose d'un point de vue graphique, et cartographique. Mais surtout, nous verrons la conception d'une carte socio avec diagrammes, par contour IRIS à Paris, qui s'appuie sur le circle packing. Tout ça en essayant d'être rigolo.


dimanche 13 mars 2016

Le bâti de Paris façon réseau ou comment faire des gribouillis avec R comme avec Processing


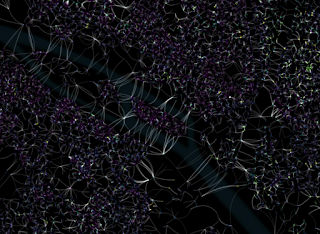
Paris sous forme de réseau. Non, on ne parle pas de rues, mais de bâti. Dans cet article, nous proposerons le passage d'une représentation à plat des bâtiments en une figuration sous forme de lignes, aux multiples évocations. On verra qu'avec R, on peut faire certaines choses comme Processing, l'outil de référence en design génératif.


jeudi 3 décembre 2015

Corine Disco Cover

This post is about the making of an experimental video that dives into the land cover of Paris & its surroundings with a hint of RGB magic. 

You'll see the purpose of gridding, how to cross a vector and a raster layer in R. Finally we'll cover one of the latest functionnality of QGIS 2.12 : data-defined layer combinations in atlases.

samedi 15 novembre 2014

Streets of Paris Colored by Orientation

Recently, I read an article by datapointed which presented maps of streets of different cities colored by orientation.
The author gave some details about the method, which I tried to reproduce. In this post, I present the different steps from the calculation in my favorite spatial R ToolBox to the rendering in QGIS using a specific blending mode.

The code is given at the end of the article.
Data used in this post is from OpenStreetMap contributors :
Get it on OSM Metro Extract or GeoFabrik

dimanche 24 novembre 2013

QGIS 2 : Artificialisation du sol en Île de France // Les modes de rendu par fusion

Dans cet article, nous allons voir comment tirer parti des modes de rendu révolutionnaires de la version QGIS 2 pour représenter le phénomène d'artificialisation en Île-de-France de 1990 à 2006.

mercredi 15 août 2012

[Sextante Plugin] An R script for Neighborhood Detection


Des bâtiments regroupés en bloc à Paris
Artice in English

[Plugin Sextante] Un script R pour détecter les voisinages : Cet article explique comment réaliser un petit script R via le plugin Sextante pour QGIS afin d'établir des relations de voisinage entre objets en fonction de la distance qui les sépare. Il comporte une petite introduction sur l'écosystème QGIS, sur R aussi. Et puis bien sûr, des détails sur l'écriture d'un script R pour le plugin Sextante GIS Plugin.


dimanche 8 avril 2012

Le carroyage avec QGIS et le plugin QMarxan, c'est facile!

Article en français 

Gridding Paris with OpenStreetMap data
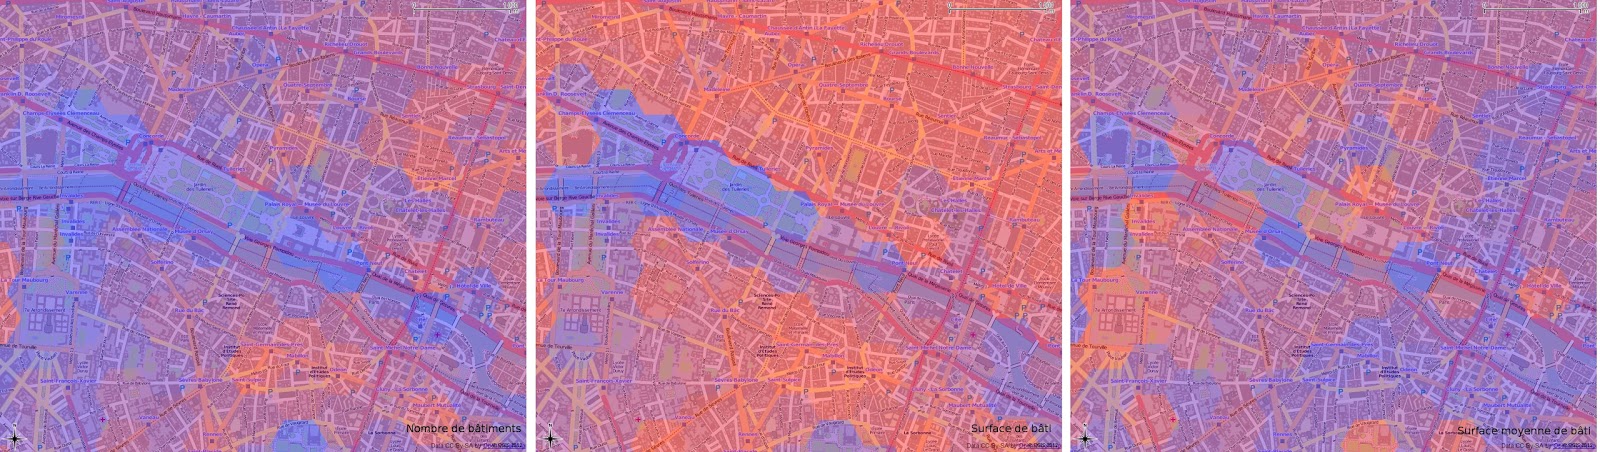
"Gridding for the dummies" ;) with Quantum GIS and QMarxan: In this article, I explain the purpose of gridding, why it is such an efficient way to analyse data within a large community of actors. Actually, gridding can be considered as a transcription of the raster format to the vector one where one tile <=> one cell. Thanks to QMarxan, gridding with QGIS is really simple:  you don't need any knowledge in PostGIS, GRASS and R to do it. That's what we'll see: in the end of the post, I detail how to constitute some gridded data through a case study aiming to process a building density analysis on the city of Paris. The article is in French, but the printscreens will be helpful for the understanding. 

All the material used in this article is free: Quantum GIS, OpenStreetMap for the buildings and INSEE (equivalent of US Census) for the population data.

lundi 12 mars 2012

Archipels de prospérité

Article en français

archipels de prospérité
Archipelagos of Prosperity test: Previously, I had mentioned a map of prosperity in France that created a buzz amongst the R community. Following the idea of mapping sociological indicators, I tested a few ways of mixing ordinal and geographical visualizations in these posts (the 1st and the 2nd). Prosperity is an actual topic in our period of crisis. I imagined a way of representig prosperity on a map, besides the choropleth and the cartogram. For the creation below, I took inspiration on a book cover that figured a chart as a fictive landscape and based on my observation of islands of prosperity on Coulmont's map, I imagined France as an oniric landscape made of archipelagos, lagoons. This exotic vision contrasts with the toughness of the subject.

mercredi 2 novembre 2011

[fr] Journée QGIS - OSGEO 2011

Il y a une semaine, le MEDDTL a abrité sous son Arche la journée OSGEO 2011 consacrée à l'outil Quantum GIS.

Cet évènement a une teneur symbolique puisqu'il témoigne de l'intérêt que portent les Ministères de l'Ecologie (MEDDTL) ainsi que de l'Agriculture (MAAPRAT) pour le logiciel libre en géomatique

Il s'agit probablement de la journée OSGEO qui a compté le plus d'agents du Ministère.

Vous trouverez ici un petit compte-rendu de la réunion. Il se peut qu'il comporte des erreurs ou des lacunes, donc n'hésitez pas à consulter en complément l'article de René-Luc sur la journée.

dimanche 26 avril 2009

QGIS routine: get the attribute values of selected features

Here, we'll learn how to access the values of a layer's selected features.

The retrieval of these values deserves many uses:
Statistics:
-some aggregation operations like sum, average, whatever...

Actions:
-Opening a picture related to a ponctual object
-Opening a web browser which URL includes one or more attribute values

Outputs:
-Export the values of selected features in a PDF report
-Opening a spreadsheet with these values so as to make graphs.

Notice: most of the actions mentionned above can also be accomplished using the QGIS actions that you access through the layer's properties.

Here is the QGIS routine that will allow you to access the attribute values of the active layer's selected features:

>>> myLayer=iface.activeLayer()
>>> objects=myLayer.selectedFeatures()
>>> objets.attributeMap()
>>> object=objects[0]
>>> attributes=object.attributeMap()
>>> attributes[0].toString()
"Bonifacio"

>>> objects=myLayer.selectedFeatures()
it returns a list of the selected objects
>>> attributes=object.attributeMap()
This attributeMap() method allows you to get the attribute values of the object you considered, in our case, the first one (object=object[0]).
It returns a dictionary which each key is an auto-incremented number. Notice that, unfortunately, the key is not the attribute name.
>>> attributes[0].toString()
Each value of the attributes is QString object. The method toString() makes it readable for the user. Here, we get the the first attribute's value.

Most often, you would combine the previous "attribute name" routine with this one.

mercredi 1 avril 2009

QGIS routine-get the fields!

Imagine you'd like to create a plugin that searches objects depending on their attributes.You'd like to display the layer fields in a combobox but how to get them?

The code shown below is often used in plugins and allows you to get the curent layer's fields.
mc=iface.getMapCanvas()
layer=mc.currentLayer()
provider=layer.getDataProvider()
fieldmap=provider.fields()
fieldmap is a list of values containing your field names.
If you want to get the name of the ith field, just type fieldmap[i] in the QGIS python console.
Maybe now you've learned how to get the layer fields, you'd like to know their values. It'll be the purpose of the next post.

first QGIS routine: get some layers


Get the current layer


Often, you'll have to perform operations on the active layer.
Before performing these operations, you first have to identify it and get it.
Once you have it, you can perform all the operations you'll want.
In the following lines, i've included print statements so as to check the content of my variables.

>>>mc=iface.getMapCanvas()
>>> mycurrentlayer=mc.currentLayer()
>>> print mycurrentlayer.getLayerID()
lakes20090310215511168
>>> print mycurrentlayer.name()
lakes

Firts of all, put the canvas in the variable mc.
>>>mc=iface.getMapCanvas()
Once you have your canvas, get its current layer called mycurrentlayer.
>>> mycurrentlayer=mc.currentLayer()

You can see some methods have been applied to the layer:
  • the method getLayerID()
  • the method name()
The layer name is only useful when displayed.
The layer id is often used whe performing operations on the layer.

Get a layer according according to its position in the legend

>>> mc=iface.getMapCanvas()
>>> myfirstlayer=mc.getZpos(1)

The method getZpos allows you to get a layer according to its position in the legend.

This kind of routine is often used when you need to get layers with their indexes

QGIS python console-Note-before beginning...

When coding QGIS plugins, you'll have to deal with objects such as the interface (iface object), the canvas, the layers of course. Each object has a certain number of attributes and methods. For example, layers have the attribute "source", or "name". They also are assigned methods like the "getSelectedFeatures" method. Notice that when applying the function "getSelectedFeatures", you get some feature objects. Like interface, canvas and layer, features are another type of object with attributes and methods. Of course, I won't list all the objects, attributes and methods avalaible through the QGIS API.

Another aspect is the notion of inheritance: the classes QgsVectorLayer and QgsRasterLayer are like brother objects, who have a common parent: the QgsMapLayer Class. They are both specific and contain different methods but what they have in common are the attributes and methods of their parent class: QgsMapLayer.

This API reflects a contemporary vision in programming called object oriented programming. All the programming books deal with this subject.

What I recommend you while reading the examples posts is having the API doc opened in your web navigator, so that you check the function, object properties I'm calling.

Let's remind you the QGIS API address:
http://doc.qgis.org/
On the website, choose your version. Most of the times, it is the kore version...

QGIS-Using the python console

As previously said, the QGIS python console is a good way to test step by step your code before implementing it to your plugin...

To access the python console, just go to plugins > python console.


Notice the example instruction in the shell iface.zoomFull(): this command is applied on the interface object called iface. It performs a zoom that makes all your objects visible.
Just try typing it in the shell to see the result:

The QGIS console is similar to a python shell but there are some limitations like the impossibility of writing multiples lines of code in one time,as it is possible with the usual python shell.

Usually, the "for" and "while" statements require multiples lines. They are often used to get lists. As the "for" and "while" statements are unavalaible, you'll have to deal with the notion of list comprehension to get a list of values.
Look at these links to learn how to use them:
http://docs.python.org/tutorial/datastructures.html
http://www.secnetix.de/olli/Python/list_comprehensions.hawk
In the examples i'll show you in the next posts, you'll see some examples of these notions.

You can also have to use map, filter, and reduce functions, that are used on lists:
http://docs.python.org/library/functions.html

To write functions, you'll have to get familiar with lambda function...
http://www.secnetix.de/olli/Python/lambda_functions.hawk