Affichage des articles dont le libellé est data analysis. Afficher tous les articles

mardi 14 février 2017

Parcourir le Monde

Quel est l'itinéraire idéal pour parcourir le Monde ? Combien de temps de vol cela prendrait ? Quels sont les deux pays les plus distants l'un de l'autre ?
Dans ce post, j'ai fait mumuse avec la carte du globe, et appris des choses au sujet des distances orthodromiques et des voyageurs de commerce. Bon voyage !


jeudi 27 octobre 2016

Le sport en France métropolitaine et le leurre cartographique

Dans ce post, nous allons voir comment réaliser un leurre cartographique, soit la réalisation d'une carte représentant un territoire totalement façonné par des données. Plus précisément, nous verrons la conception d'un territoire de la pratique sportive par départements en France.&nbsp


dimanche 8 avril 2012

Le carroyage avec QGIS et le plugin QMarxan, c'est facile!

Article en français 

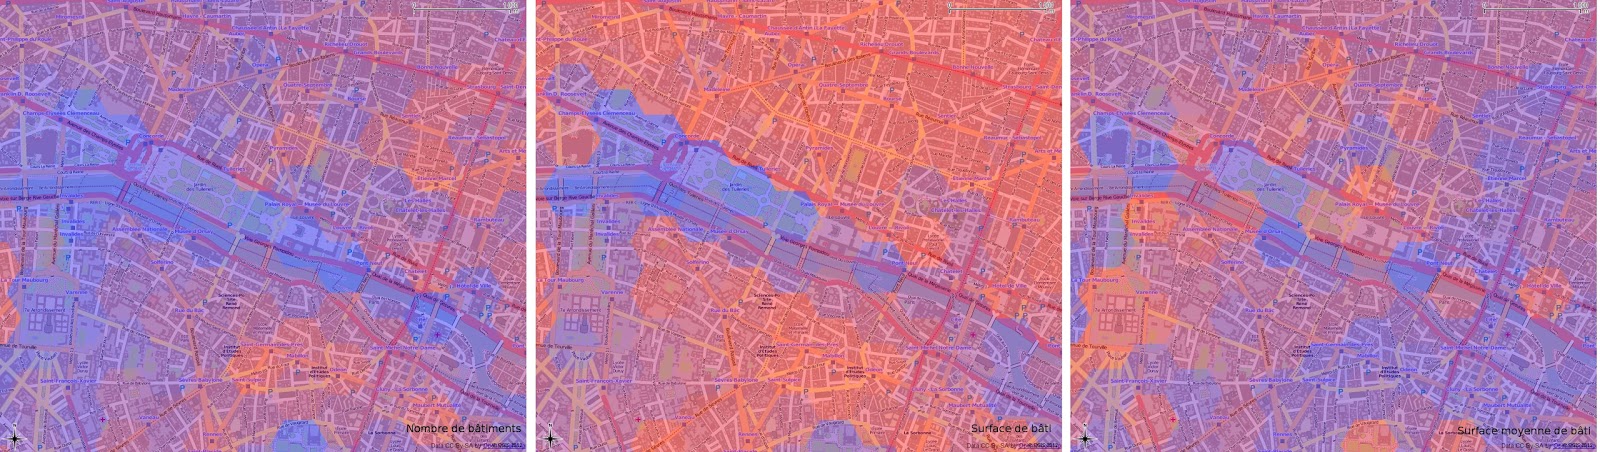
Gridding Paris with OpenStreetMap data
"Gridding for the dummies" ;) with Quantum GIS and QMarxan: In this article, I explain the purpose of gridding, why it is such an efficient way to analyse data within a large community of actors. Actually, gridding can be considered as a transcription of the raster format to the vector one where one tile <=> one cell. Thanks to QMarxan, gridding with QGIS is really simple:  you don't need any knowledge in PostGIS, GRASS and R to do it. That's what we'll see: in the end of the post, I detail how to constitute some gridded data through a case study aiming to process a building density analysis on the city of Paris. The article is in French, but the printscreens will be helpful for the understanding. 

All the material used in this article is free: Quantum GIS, OpenStreetMap for the buildings and INSEE (equivalent of US Census) for the population data.