This presentation is a translation of the related post
In the context of the Geomatics Community Meeting Day organized by the French Ministry of Environement, Sustainable Development and the Ministry of Agriculture, I was invited to present the ETL Spatial Data Integrator.
I've tried to translate this presentation in english to share it to the largest public as possible.
The presentation contains many screen prints of processes. It's been made in a didactic way so that you can recur the processes on your computer. Even if you don't practice, I hope you'll get an idea of some posibilities offered by a spatial ETL.
Good reading!

samedi 27 mars 2010
mercredi 6 janvier 2010
1st post of the year!
I wish to all of you a happy new year. My best wishes for 2010!
I then want to thank everyone for consulting my blog. It's a pleasure to share knowledge amongst the OSGeo community.
I hope you have the same pleasure reading this blog that I have while reading other blogs on the web.
The OSGeo world is so active I discover new things every day!
I wrote the first article on the 17th of March 2009.
The post was about the power of an opensource GIS software as QGIS in an organization and announced a content strongly oriented on Open Source Softwares. It was an honor to see this post mentioned on RL D'Hont's blog, a very popular geo blog.
Since then, I tried to feed my blog regularly, with around 1 post per month.
Though French, I wanted to write this blog in english to allow the great majority of people to access its content, while practicing my english (I don't have this opportunity in my current job).
I was very surprised to see that people from all around the world consulted datagistips. I must admit I didn't expect that! That's one power of the web to make knowledge accessible to every one.
I often like to look at some statistics of consultation. These are the ones from the birth of the blog till now:

Let's have a closer look:

- The fact that France is at the top is not surprising: some articles are still in french, like the one about spatial data integration that I plan to translate.
- USA and Canada are then on the list, not surprisingly.
The fact that India has counted more visitors that United Kingdom and that it is in the "top 10" quite astonishes me!
- The same for Brazil that counts more visitors than European countries like UK and Belgium.
It reflects a global interest, not restricted to certain parts of the world. It kind of motivates me keeping on publishing.
I still have many ideas about posts that would potentially raise your interest. The use of Business Intelligence in geographical contexts gets more and more famous. I'll keep on writing some articles about this domain. You'll find some tips/tutorials about controlling data (quality, etc..), a critical function in all organizations, because it is strategic and time-consuming.
Also, I'm sure you'd like to read articles about Web developing. I've got some ideas of posts about programming with OpenLayers, jQuery.
Anyway, whatever you are interested in, if your concerns are about data and GIS, stay tuned!
Best,
Mathieu
I then want to thank everyone for consulting my blog. It's a pleasure to share knowledge amongst the OSGeo community.
I hope you have the same pleasure reading this blog that I have while reading other blogs on the web.
The OSGeo world is so active I discover new things every day!
I wrote the first article on the 17th of March 2009.
The post was about the power of an opensource GIS software as QGIS in an organization and announced a content strongly oriented on Open Source Softwares. It was an honor to see this post mentioned on RL D'Hont's blog, a very popular geo blog.
Since then, I tried to feed my blog regularly, with around 1 post per month.
Though French, I wanted to write this blog in english to allow the great majority of people to access its content, while practicing my english (I don't have this opportunity in my current job).
I was very surprised to see that people from all around the world consulted datagistips. I must admit I didn't expect that! That's one power of the web to make knowledge accessible to every one.
I often like to look at some statistics of consultation. These are the ones from the birth of the blog till now:

Let's have a closer look:

- The fact that France is at the top is not surprising: some articles are still in french, like the one about spatial data integration that I plan to translate.
- USA and Canada are then on the list, not surprisingly.
The fact that India has counted more visitors that United Kingdom and that it is in the "top 10" quite astonishes me!
- The same for Brazil that counts more visitors than European countries like UK and Belgium.
It reflects a global interest, not restricted to certain parts of the world. It kind of motivates me keeping on publishing.
I still have many ideas about posts that would potentially raise your interest. The use of Business Intelligence in geographical contexts gets more and more famous. I'll keep on writing some articles about this domain. You'll find some tips/tutorials about controlling data (quality, etc..), a critical function in all organizations, because it is strategic and time-consuming.
Also, I'm sure you'd like to read articles about Web developing. I've got some ideas of posts about programming with OpenLayers, jQuery.
Anyway, whatever you are interested in, if your concerns are about data and GIS, stay tuned!
Best,
Mathieu

vendredi 4 décembre 2009
One simple example of using GDAL/OGR together with Talend or how to get rid of scripts
In this post, you can replace any mention to Talend by Spatial Data Integrator as this latter software is an extension of the initial Talend
One goal of some ETL tools like Talend is to avoid writing multiple and complex lines of code and speed the conception and execution of integration processes. All the operations are designed in a workspace. The administrator picks the components he needs from a palette and links them. Behind, Java or Perl lines of code are generated but the casual administrator wouldn't need to read nor modify these lines. Somewhat, Talend offers a graphical and friendly way for programming.
Spatial Data Integrator is just Talend to which spatial components and functions have been added. The java libraries behind are GeoTools, Java Topology suite and Sextante. Despite the richness of functionalities, you won't find some components needed for some specific operations. In particular, Talend SDI doesn't support as many formats as OGR. Therefore, you can't convert your files between some specific formats. Besides, in Talend SDI, for the conversion case, it requires knowing the structure of your files (called schemas) in advance. It's a prerequisite that limits massive format-converting.
Happily, Talend is flexible enough to allow the administrator to enrich the application with additional Java libraries and to launch command line tools. Talend will allow you to easily integrate GDAL/OGR operations inside complex processes with only one line of code. Actually, depending on the utility, it's the single line of code one is supposed to know.
Many people ask on forums how to use GDAL/OGR over a series of files, for instance how to convert a bunch of ESRI files into KML Files. The given solutions require knowing some elements in shell or batch scripting. Depending on the case, the script could become quite big, thus difficult to maintain (even more when considering one sometimes copies-pastes the lines of code without really understanding them).
Let's look at the solution given by Tim Sutton, a well-known developer in the OSGeo world, to convert a directory of tiffs to ecw. The SHP to KML script would look alike.
As you can see, skills in programming are obvious.
Designing the conversion process in Talend is quite easy as it uses only two components. The first one lists the files inside a folder and the second applies the OGR2OGR command over each of them. This case is one of the simplest example of integrating GDAL/OGR command line tools in Talend.
Let's examine the job:
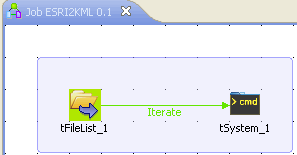
Let's look at the tFileList component:
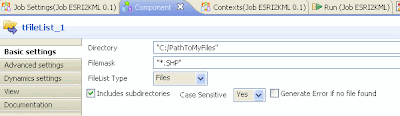 No explanation needed: just looking at the component properties is explicit enough, far more than multiple lines of code.
Now, let's look at the tSystem properties in which we launch the OGR2OGR command:
 The command is the following one:
"ogr2ogr -f \"KML\" "+((String)globalMap.get("tFileList_1_CURRENT_FILEPATH")).replace("SHP","KML")+" "+((String)globalMap.get("tFileList_1_CURRENT_FILEPATH"))
This job gives you the main principle for using a command line tool like GDAL/OGR together with Talend. You could do the same with gdalwarp, gdal_translate commands. As the method is mainly graphical and intuitive, it's easier to develop and to maintain than a shell or batch script. This kind of operation could get more complex when being part of a job that includes other Talend SDI components.
The possibility of transmitting the result of a command to other components can lead to powerful processes, complex, yet at the same easy to improve and maintain. We'll see one example of command outputting in a future post.
One goal of some ETL tools like Talend is to avoid writing multiple and complex lines of code and speed the conception and execution of integration processes. All the operations are designed in a workspace. The administrator picks the components he needs from a palette and links them. Behind, Java or Perl lines of code are generated but the casual administrator wouldn't need to read nor modify these lines. Somewhat, Talend offers a graphical and friendly way for programming.
Spatial Data Integrator is just Talend to which spatial components and functions have been added. The java libraries behind are GeoTools, Java Topology suite and Sextante. Despite the richness of functionalities, you won't find some components needed for some specific operations. In particular, Talend SDI doesn't support as many formats as OGR. Therefore, you can't convert your files between some specific formats. Besides, in Talend SDI, for the conversion case, it requires knowing the structure of your files (called schemas) in advance. It's a prerequisite that limits massive format-converting.
Happily, Talend is flexible enough to allow the administrator to enrich the application with additional Java libraries and to launch command line tools. Talend will allow you to easily integrate GDAL/OGR operations inside complex processes with only one line of code. Actually, depending on the utility, it's the single line of code one is supposed to know.
Many people ask on forums how to use GDAL/OGR over a series of files, for instance how to convert a bunch of ESRI files into KML Files. The given solutions require knowing some elements in shell or batch scripting. Depending on the case, the script could become quite big, thus difficult to maintain (even more when considering one sometimes copies-pastes the lines of code without really understanding them).
Let's look at the solution given by Tim Sutton, a well-known developer in the OSGeo world, to convert a directory of tiffs to ecw. The SHP to KML script would look alike.
#!/bin/bash
mkdir ecw
for FILE in *.tif
do
BASENAME=$(basename $FILE .tif)
OUTFILE=ecw/${BASENAME}.ecw
echo "Processing: ${BASENAME}.tif"
if [ -f $OUTFILE ] #skip if exists
then
 echo "Skipping: $OUTFILE"
else
 /usr/local/bin/gdal_translate -of ECW -co LARGE_OK=YES $FILE $OUTFILE
fi
done
As you can see, skills in programming are obvious.
Designing the conversion process in Talend is quite easy as it uses only two components. The first one lists the files inside a folder and the second applies the OGR2OGR command over each of them. This case is one of the simplest example of integrating GDAL/OGR command line tools in Talend.
Let's examine the job:

Let's look at the tFileList component:
 No explanation needed: just looking at the component properties is explicit enough, far more than multiple lines of code.
Now, let's look at the tSystem properties in which we launch the OGR2OGR command:
 The command is the following one:
"ogr2ogr -f \"KML\" "+((String)globalMap.get("tFileList_1_CURRENT_FILEPATH")).replace("SHP","KML")+" "+((String)globalMap.get("tFileList_1_CURRENT_FILEPATH"))
- ((String)globalMap.get("tFileList_1_CURRENT_FILEPATH")) is the complete ESRI file path returned by the tFileList component. You access this global variable by typing the Ctrl-Space shortcut.
- ((String)globalMap.get("tFileList_1_CURRENT_FILEPATH")).replace("SHP","KML") is the complete ESRI File Path in which we replace "SHP" by "KML". The KML file will be generated in the same folder as the ESRI GIS files.
- \" escapes the " character.
This job gives you the main principle for using a command line tool like GDAL/OGR together with Talend. You could do the same with gdalwarp, gdal_translate commands. As the method is mainly graphical and intuitive, it's easier to develop and to maintain than a shell or batch script. This kind of operation could get more complex when being part of a job that includes other Talend SDI components.
The possibility of transmitting the result of a command to other components can lead to powerful processes, complex, yet at the same easy to improve and maintain. We'll see one example of command outputting in a future post.
mardi 6 octobre 2009
[fr] Présentation de Spatial Data Integrator, logiciel d'intégration de données SIG (mais pas que..)
The powerpoint below will be translated in english soon
La réorganisation de l'Etat, notamment la fusion des services Déconcentrés, fait ressortir un large spectre de problématiques liées à la gestion de patrimoines de données. En rapprochant des personnes, des activités, c'est des infrastructures qu'il faut faire converger.
Tout l'enjeu consiste à maîtriser l'accroissement de la quantité de données, à homogénéiser les formats de stockage qui pouvaient être différents d'une structure à l'autre et à normaliser les méthodes de documentation et de traçabilité des données (qui pouvaient se faire via des fiches de méta-données).
La mutualisation des patrimoines de données, et des méthodes, est un élément qui affectera de manière importante l'appréciation que l'équipe de pilotage fera quant à la qualité de la fusion. Elle sera perçue comme stratégique et fera l'objet de beaucoup d'insistance.
Dans ce contexte, et parce que les délais sont courts, les équipes chargées de l'administration et de la valorisation des données doivent faire preuve d'une grande réactivité. La facilité avec laquelle elles pourront répondre au besoin d'unification est néanmoins tributaire des moyens disponibles. Il est donc essentiel qu'elles disposent de solutions clé en main leur permettant d'intervenir efficacement sur le système d'information décisionnel de leur structure selon la démarche projet qu'elles auront adoptée.
Lors de Journées Nationales du Réseau Géomatique qui rassemblaient des acteurs et responsables SIG du Ministère de l'Ecologie, de l'Energie, du Développement durable et de la Mer ainsi que du Ministère de l'Agriculture et de la Pêche, je fus invité à présenter une de ces solutions: Spatial Data Integrator, logiciel d'intégration de données géographiques(...mais pas que).
C'est le diaporama de cette présentation que je vous propose. En voici son articulation:
-Dans un premier temps, l'outil est présenté assez rapidement...
-...pour passer à une démo simple mais néanmoins utile qu'est la gestion des rejets lors de la jointure d'un fichier excel et d'un fichier géographique...
-...puis enfin, 4 cas d'utilisation sont abordés qui sont bien sûr transposables hors du domaine de l'Administration
Le présentiel comporte de nombreuses copies d'écran issues du logiciel qui vous aideront à reproduire les jobs.
La réorganisation de l'Etat, notamment la fusion des services Déconcentrés, fait ressortir un large spectre de problématiques liées à la gestion de patrimoines de données. En rapprochant des personnes, des activités, c'est des infrastructures qu'il faut faire converger.
Tout l'enjeu consiste à maîtriser l'accroissement de la quantité de données, à homogénéiser les formats de stockage qui pouvaient être différents d'une structure à l'autre et à normaliser les méthodes de documentation et de traçabilité des données (qui pouvaient se faire via des fiches de méta-données).
La mutualisation des patrimoines de données, et des méthodes, est un élément qui affectera de manière importante l'appréciation que l'équipe de pilotage fera quant à la qualité de la fusion. Elle sera perçue comme stratégique et fera l'objet de beaucoup d'insistance.
Dans ce contexte, et parce que les délais sont courts, les équipes chargées de l'administration et de la valorisation des données doivent faire preuve d'une grande réactivité. La facilité avec laquelle elles pourront répondre au besoin d'unification est néanmoins tributaire des moyens disponibles. Il est donc essentiel qu'elles disposent de solutions clé en main leur permettant d'intervenir efficacement sur le système d'information décisionnel de leur structure selon la démarche projet qu'elles auront adoptée.
Lors de Journées Nationales du Réseau Géomatique qui rassemblaient des acteurs et responsables SIG du Ministère de l'Ecologie, de l'Energie, du Développement durable et de la Mer ainsi que du Ministère de l'Agriculture et de la Pêche, je fus invité à présenter une de ces solutions: Spatial Data Integrator, logiciel d'intégration de données géographiques(...mais pas que).
C'est le diaporama de cette présentation que je vous propose. En voici son articulation:
-Dans un premier temps, l'outil est présenté assez rapidement...
-...pour passer à une démo simple mais néanmoins utile qu'est la gestion des rejets lors de la jointure d'un fichier excel et d'un fichier géographique...
-...puis enfin, 4 cas d'utilisation sont abordés qui sont bien sûr transposables hors du domaine de l'Administration
Le présentiel comporte de nombreuses copies d'écran issues du logiciel qui vous aideront à reproduire les jobs.
jeudi 2 juillet 2009
Business Intelligence and Geospatial BI opensource softwares

The increasing amount of numeric data makes it difficult to control, to master.
The abundance of formats: excel files, XML, data stored in databases like Oracle, MySQL, PostgreSQL can be constraining.
Human intelligence is not sufficient to solve complex cases where many parameters must be taken into account.
Quoting Wikipedia, "Business Intelligence refers to skills, technologies, applications and practices used to help a business acquire a better understanding of its commercial context. Business intelligence may also refer to the collected information itself".
Note that even if there is Business in this term, BI is not only used in commercial and economic contexts.
Here are some goals of Business Intelligence:
- Breaking the barriers between formats so as to proceed joins, crosses, and building homogeneous infrastructures. We also need good performance in data treatment, its quantity being huge.
- Giving us direct and graphical informations for what we need. These selected informations are usually displayed through graphs, reports and dashboards.
- Helping us in making good decisions. Putting dimensions into data, not only relations, allows instaurating hierarchical relationships between them. It refines our analysis and helps us prioritizing our actions. On Line Analysis Processing reflects this approach.
- Synthetizing. The use of complex algorithms, statistic techniques will uncover patterns or even predict phenomenons that wouldn't have been "macroscopically" detected by a human being. That's what we call data mining.
This schema was taken and translated from piloter.org, a french reference portal on business performance management. It illustrates the different components of Business Intelligence.

Globally, BI divides itself into two main domains: integration and valorization. Integration is at the top of the BI chain. It consists in collecting and storing data while valorization aims at distributing and exploiting it.


In the opensource world, two integration tools distinguish themselves: Pentaho and Talend.
- kettle, a component of pentaho, a complete BI suite.
- Talend is developed by a french company. It was awarded "company-to-watch" by the Intelligent Enterprise Magazine.
- Extract: they read many data sources
- Transform: they can apply treatments to data, convert them between different formats
- Load: they include "write" features
The advantage of kettle is that it's part of a complete BI suite. The other modules of pentaho are Mondrian, an OLAP server, Pentaho reports, Pentaho DashBoards, Pentaho Weka for data mining.
Talend provides connectors to many valorization tools like PALO, Jaspersoft or SpagoBI. It integrates itself well in a complete BI environment. The Jaspersoft Suite includes Talend, where it's been renamed JasperETL.
OpenSource BI softwares are still young but they gain more and more popularity amongst big companies.
Geographical data is like any kind of data. To add the geographical dimension to a standard set of data, you would just add a geometry column describing the graphical properties of each row. While you can compare strings between them, proceed mathematical operations on numbers, what you can perform on geometry are intersections, union, splitting, difference,...
Integrating the geographical dimension to the ETL tools raised the interest of
the GIS societies and Community. Geopolitics, geomarketing are some domains in which we would use Spatial OLAP analysises and geographical reports. Also, they would be useful to face some contemporary issues like the understanding of how migrations of population are correlated with climate change.
In the opensource geospatial BI world, we can distinguish two integration softwares.
- GeoKettle is based on Kettle by Pentaho. It was developed at the canadian Laval university by the team of Dr Badard.
- Spatial Data Integrator is based on Talend and developed by CamptoCamp, a famous french geospatial company.
The complete geospatial BI suite based on Pentaho will be presented at the Foss4G 2009.
Here is a set of operations you can accomplish with a spatial ETL:
- Transform a complete folder of shapefiles into PostGIS Tables
- Mass Coordinate Reference System transforming
- Joining multiple data sources, like a MySQL Table with a geographic File.
- Geographical Data quality control.
Most of the next posts of this blog will deal with Spatial Data Integrator. I haven't tested GeoKettle but what I can say is that SDI is really friendly to use. Even if SDI is not part of a complete geospatial BI suite, nothing prevents you from using the canadian geospatial valorization tools GeoMondrian and Spatialytics in addition to it.
Inscription à :
Articles (Atom)