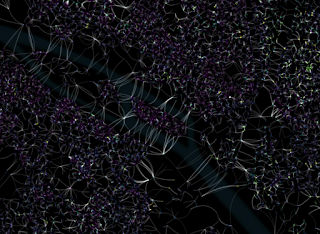
 Paris sous forme de réseau. Non, on ne parle pas de rues, mais de bâti. Dans cet article, nous proposerons le passage d'une représentation à plat des bâtiments en une figuration sous forme de lignes, aux multiples évocations. On verra qu'avec R, on peut faire certaines choses comme Processing, l'outil de référence en design génératif.
dimanche 13 mars 2016
Le bâti de Paris façon réseau ou comment faire des gribouillis avec R comme avec Processing
Paris sous forme de réseau. Non, on ne parle pas de rues, mais de bâti. Dans cet article, nous proposerons le passage d'une représentation à plat des bâtiments en une figuration sous forme de lignes, aux multiples évocations. On verra qu'avec R, on peut faire certaines choses comme Processing, l'outil de référence en design génératif.
mardi 12 janvier 2016
Plongée dans l'absurde de la cartographie
 Ça et là apparaissent sur la Toile des cartes qui revisitent des thématiques a priori banales sous un angle d'approche assez insolite.
Dans ce billet de début d'année, nous en listerons quelques-unes avant de nous attaquer à la réalisation d'une carte qui soulève les océans et immerge les montagnes.
Attention, tout ce qui suit ne doit pas toujours êtres pris au premier degré.
jeudi 3 décembre 2015
Corine Disco Cover
 This post is about the making of an experimental video that dives into the land cover of Paris & its surroundings with a hint of RGB magic.
 You'll see the purpose of gridding, how to cross a vector and a raster layer in R. Finally we'll cover one of the latest functionnality of QGIS 2.12 : data-defined layer combinations in atlases.
samedi 15 novembre 2014
Streets of Paris Colored by Orientation

The author gave some details about the method, which I tried to reproduce. In this post, I present the different steps from the calculation in my favorite spatial R ToolBox to the rendering in QGIS using a specific blending mode.
The code is given at the end of the article.
Data used in this post is from OpenStreetMap contributors :
Get it on OSM Metro Extract or GeoFabrik
Data used in this post is from OpenStreetMap contributors :
Get it on OSM Metro Extract or GeoFabrik
samedi 7 juin 2014
whatGoogleSuggestsFor() : Using Google Instant to map Stereotypes or Sentiment (in R)

Some interesting things emerge when using Google Instant service from different countries.
 The whatGoogleSuggestsFor() function will take a string as an input and return a list of suggestions by Google based upon Google Instant Service. Good to map stereotypes or analyze sentiment of a brand. The code is at the end.
Inscription à :
Articles (Atom)