vendredi 4 décembre 2009

One simple example of using GDAL/OGR together with Talend or how to get rid of scripts

In this post, you can replace any mention to Talend by Spatial Data Integrator as this latter software is an extension of the initial Talend

One goal of some ETL tools like Talend is to avoid writing multiple and complex lines of code and speed the conception and execution of integration processes. All the operations are designed in a workspace. The administrator picks the components he needs from a palette and links them. Behind, Java or Perl lines of code are generated but the casual administrator wouldn't need to read nor modify these lines. Somewhat, Talend offers a graphical and friendly way for programming.

Spatial Data Integrator is just Talend to which spatial components and functions have been added. The java libraries behind are GeoTools, Java Topology suite and Sextante. Despite the richness of functionalities, you won't find some components needed for some specific operations. In particular, Talend SDI doesn't support as many formats as OGR. Therefore, you can't convert your files between some specific formats. Besides, in Talend SDI, for the conversion case, it requires knowing the structure of your files (called schemas) in advance. It's a prerequisite that limits massive format-converting.

Happily, Talend is flexible enough to allow the administrator to enrich the application with additional Java libraries and to launch command line tools. Talend will allow you to easily integrate GDAL/OGR operations inside complex processes with only one line of code. Actually, depending on the utility, it's the single line of code one is supposed to know.

Many people ask on forums how to use GDAL/OGR over a series of files, for instance how to convert a bunch of ESRI files into KML Files. The given solutions require knowing some elements in shell or batch scripting. Depending on the case, the script could become quite big, thus difficult to maintain (even more when considering one sometimes copies-pastes the lines of code without really understanding them).

Let's look at the solution given by Tim Sutton, a well-known developer in the OSGeo world, to convert a directory of tiffs to ecw. The SHP to KML script would look alike.
#!/bin/bash
mkdir ecw
for FILE in *.tif
do
BASENAME=$(basename $FILE .tif)
OUTFILE=ecw/${BASENAME}.ecw
echo "Processing: ${BASENAME}.tif"
if [ -f $OUTFILE ] #skip if exists
then
 echo "Skipping: $OUTFILE"
else
 /usr/local/bin/gdal_translate -of ECW -co LARGE_OK=YES $FILE $OUTFILE
fi
done

As you can see, skills in programming are obvious.

Designing the conversion process in Talend is quite easy as it uses only two components. The first one lists the files inside a folder and the second applies the OGR2OGR command over each of them. This case is one of the simplest example of integrating GDAL/OGR command line tools in Talend.

Let's examine the job:


Let's look at the tFileList component:

No explanation needed: just looking at the component properties is explicit enough, far more than multiple lines of code.

Now, let's look at the tSystem properties in which we launch the OGR2OGR command:

The command is the following one:
"ogr2ogr -f \"KML\" "+((String)globalMap.get("tFileList_1_CURRENT_FILEPATH")).replace("SHP","KML")+" "+((String)globalMap.get("tFileList_1_CURRENT_FILEPATH"))

  • ((String)globalMap.get("tFileList_1_CURRENT_FILEPATH")) is the complete ESRI file path returned by the tFileList component. You access this global variable by typing the Ctrl-Space shortcut.
  • ((String)globalMap.get("tFileList_1_CURRENT_FILEPATH")).replace("SHP","KML") is the complete ESRI File Path in which we replace "SHP" by "KML". The KML file will be generated in the same folder as the ESRI GIS files.
  • \" escapes the " character.

This job gives you the main principle for using a command line tool like GDAL/OGR together with Talend. You could do the same with gdalwarp, gdal_translate commands. As the method is mainly graphical and intuitive, it's easier to develop and to maintain than a shell or batch script. This kind of operation could get more complex when being part of a job that includes other Talend SDI components.

The possibility of transmitting the result of a command to other components can lead to powerful processes, complex, yet at the same easy to improve and maintain. We'll see one example of command outputting in a future post.

mardi 6 octobre 2009

[fr] Présentation de Spatial Data Integrator, logiciel d'intégration de données SIG (mais pas que..)

The powerpoint below will be translated in english soon

La réorganisation de l'Etat, notamment la fusion des services Déconcentrés, fait ressortir un large spectre de problématiques liées à la gestion de patrimoines de données. En rapprochant des personnes, des activités, c'est des infrastructures qu'il faut faire converger.

Tout l'enjeu consiste à maîtriser l'accroissement de la quantité de données, à homogénéiser les formats de stockage qui pouvaient être différents d'une structure à l'autre et à normaliser les méthodes de documentation et de traçabilité des données (qui pouvaient se faire via des fiches de méta-données).

La mutualisation des patrimoines de données, et des méthodes, est un élément qui affectera de manière importante l'appréciation que l'équipe de pilotage fera quant à la qualité de la fusion. Elle sera perçue comme stratégique et fera l'objet de beaucoup d'insistance.

Dans ce contexte, et parce que les délais sont courts, les équipes chargées de l'administration et de la valorisation des données doivent faire preuve d'une grande réactivité. La facilité avec laquelle elles pourront répondre au besoin d'unification est néanmoins tributaire des moyens disponibles. Il est donc essentiel qu'elles disposent de solutions clé en main leur permettant d'intervenir efficacement sur le système d'information décisionnel de leur structure selon la démarche projet qu'elles auront adoptée.

Lors de Journées Nationales du Réseau Géomatique qui rassemblaient des acteurs et responsables SIG du Ministère de l'Ecologie, de l'Energie, du Développement durable et de la Mer ainsi que du Ministère de l'Agriculture et de la Pêche, je fus invité à présenter une de ces solutions: Spatial Data Integrator, logiciel d'intégration de données géographiques(...mais pas que).

C'est le diaporama de cette présentation que je vous propose. En voici son articulation:
-Dans un premier temps, l'outil est présenté assez rapidement...
-...pour passer à une démo simple mais néanmoins utile qu'est la gestion des rejets lors de la jointure d'un fichier excel et d'un fichier géographique...
-...puis enfin, 4 cas d'utilisation sont abordés qui sont bien sûr transposables hors du domaine de l'Administration

Le présentiel comporte de nombreuses copies d'écran issues du logiciel qui vous aideront à reproduire les jobs.

jeudi 2 juillet 2009

Business Intelligence and Geospatial BI opensource softwares


The increasing amount of numeric data makes it difficult to control, to master.
The abundance of formats: excel files, XML, data stored in databases like Oracle, MySQL, PostgreSQL can be constraining.
Human intelligence is not sufficient to solve complex cases where many parameters must be taken into account.

Quoting Wikipedia, "Business Intelligence refers to skills, technologies, applications and practices used to help a business acquire a better understanding of its commercial context. Business intelligence may also refer to the collected information itself".
Note that even if there is Business in this term, BI is not only used in commercial and economic contexts.

Here are some goals of Business Intelligence:
- Breaking the barriers between formats so as to proceed joins, crosses, and building homogeneous infrastructures. We also need good performance in data treatment, its quantity being huge.
- Giving us direct and graphical informations for what we need. These selected informations are usually displayed through graphs, reports and dashboards.
- Helping us in making good decisions. Putting dimensions into data, not only relations, allows instaurating hierarchical relationships between them. It refines our analysis and helps us prioritizing our actions. On Line Analysis Processing reflects this approach.
- Synthetizing. The use of complex algorithms, statistic techniques will uncover patterns or even predict phenomenons that wouldn't have been "macroscopically" detected by a human being. That's what we call data mining.

This schema was taken and translated from piloter.org, a french reference portal on business performance management. It illustrates the different components of Business Intelligence.


Globally, BI divides itself into two main domains: integration and valorization. Integration is at the top of the BI chain. It consists in collecting and storing data while valorization aims at distributing and exploiting it.


In the opensource world, two integration tools distinguish themselves: Pentaho and Talend.
  • kettle, a component of pentaho, a complete BI suite.
  • Talend is developed by a french company. It was awarded "company-to-watch" by the Intelligent Enterprise Magazine.
Integration tools are also called ETL for "Extract, Transform and Load" :
  • Extract: they read many data sources
  • Transform: they can apply treatments to data, convert them between different formats
  • Load: they include "write" features

The advantage of kettle is that it's part of a complete BI suite. The other modules of pentaho are Mondrian, an OLAP server, Pentaho reports, Pentaho DashBoards, Pentaho Weka for data mining.
Talend provides connectors to many valorization tools like PALO, Jaspersoft or SpagoBI. It integrates itself well in a complete BI environment. The Jaspersoft Suite includes Talend, where it's been renamed JasperETL.

OpenSource BI softwares are still young but they gain more and more popularity amongst big companies.

Geographical data is like any kind of data. To add the geographical dimension to a standard set of data, you would just add a geometry column describing the graphical properties of each row. While you can compare strings between them, proceed mathematical operations on numbers, what you can perform on geometry are intersections, union, splitting, difference,...

Integrating the geographical dimension to the ETL tools raised the interest of
the GIS societies and Community. Geopolitics, geomarketing are some domains in which we would use Spatial OLAP analysises and geographical reports. Also, they would be useful to face some contemporary issues like the understanding of how migrations of population are correlated with climate change.

In the opensource geospatial BI world, we can distinguish two integration softwares.
  • GeoKettle is based on Kettle by Pentaho. It was developed at the canadian Laval university by the team of Dr Badard.
  • Spatial Data Integrator is based on Talend and developed by CamptoCamp, a famous french geospatial company.
The advantage of GeoKettle is that it is part of a complete geospatial BI suite, as Kettle is. The other components of the suite are GeoMondrian, a spatial OLAP server and Spatialytics for navigation into SOLAP data cubes and dashboards.
The complete geospatial BI suite based on Pentaho will be presented at the Foss4G 2009.

Here is a set of operations you can accomplish with a spatial ETL:
  • Transform a complete folder of shapefiles into PostGIS Tables
  • Mass Coordinate Reference System transforming
  • Joining multiple data sources, like a MySQL Table with a geographic File.
  • Geographical Data quality control.
Globally, spatial ETL tools will help you build and maintain a solid spatial data infrastructure very fast and efficiently.

Most of the next posts of this blog will deal with Spatial Data Integrator. I haven't tested GeoKettle but what I can say is that SDI is really friendly to use. Even if SDI is not part of a complete geospatial BI suite, nothing prevents you from using the canadian geospatial valorization tools GeoMondrian and Spatialytics in addition to it.

jeudi 18 juin 2009

Freemind tip: explore and edit your XML Files

More and more, we use XML files to store data.
The XML file format gives structure to data in a hierarchical way. Thanks to its validation rules, the compliance of data can be checked. Most development languages allow parsing them in order retrieve a specific data.

Here are some examples of XML-based Files in the GIS World:
  • KML, aka Keyhole Markup Language has been developed by google.
  • GML, geographical markup language.
  • GeoRSS, the RSS files with embedded location data.
  • SLD, Styled Layer Descriptor, which permits advanced map renderings.
  • getfeatureinfo request responses returned by a WMS server.
You can read XML files in your web browser but it turns out to be limited and very static.
With Freemind, you can add metadata to nodes like web links, notes, which can be useful if you'd like to collaborate on an XML file before releasing a final version of it.
Also, you can highlight some nodes, add some markers (icons for example), things that are helpful when you start learning a specific XML-based format.

Freemind and XMLs


Freemind is used to represent and organize ideas in a hierarchical, dynamic and graphical way. The Freemind files are XML-based files with a .mm extension.

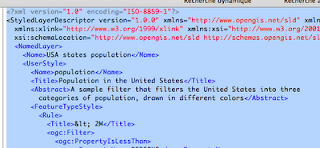
Let's take the case of an SLD file. Its structure is rich and complex. I'd like to comfortably explore it before editing it. Freemind will ease navigation through it. Here are the steps to import our SLD file in Freemind.
The operation is valid for any XML files, so you can do it for KMLs.

1 -I open my SLD file in a text editor and I copy all the text

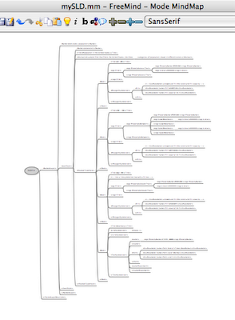
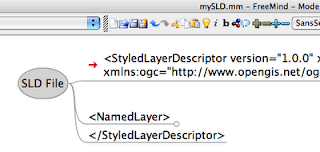
2 - Then I simply paste it in FreeMind. Here is the result:


As you can see, my initial linear text has been rendered in a tree-structured way, which is much more readable and attractive. it's much more comfortable to edit as well.

By default, after pasting your text, all your nodes are unfolded. You'd surely prefer to get all your nodes folded and unfold only the nodes you want.
To fold all the nodes, just pass your cursor over the root node and select in the navigation item > "fold all the nodes".

Now, you can use FreeMind features:
  • zooming, automatic folding and unfolding.
  • add nodes, edit nodes
  • take notes,
  • add attributes, icons...
  • attach web links to nodes
  • filtering your nodes by their icons or attributes.
To export your mindmap to an XML:
1 - select the node you want, most often the root node, press copy
2 - then paste in a text editing tool. Now you've got your xml. Note that the icons and attributes you added in Freemind have no consequences on the content of your XML but beware of the "note" nodes you might have added. These ones will be considered as XML nodes.

FreeMind is a pretty efficient for taking notes.
One goal of Freemind is to implement a mode in which people would collaborate on a common file over the internet.

vendredi 5 juin 2009

Unexpected Uses of OpenLayers

As I went through the websites listed in the OpenLayers Gallery, I was surprised of some unexpected uses of the javascript library. Discovering them made me enthusiastic. I decided to make a post about these strange maps...

Here is the collection I noticed. If you have some more, why not sharing them!

Mathematics : Mandelbrot Fractal Browser


With this project, you can navigate through a mandelbrot fractal frame.
You can zoom in or out. All along your navigation, you won't get lost in this infinity of forms thanks to the overview map.
OpenLayers was obviously the most convenient technology for this kind of displaying.
This website makes intelligent use of the resolution configuring, the zooming capabilities and ergonomic characteristics of OpenLayers.

Biology : Genome browser


What if, in the same manner as above, you could explore the genome?
That's what this website allows you to accomplish.
The coordinates are, here, replaced by the base pairs position and each genome's area is georeferenced.
A click on a region triggers the display of its characteristics.
Really nice!

The code is avalaible on google code. If you're curious about it, check it out here.

Gaming : Pentamino puzzle


This website demonstrates extensive use of OpenLayers' Vector Capabilities.
The build of such an interface is a real technical challenge.

Communication : Rosetta Project


The rosetta project aims at building an archive of all the languages in the world.
A very rich image representing the Earth with languages labels emerging from the continents helps you find your way in this tremendous collection.
With such an attractive and interactive homepage, you want to go deeper into the subject.


These examples show localization in fields where it wasn't expected.
It shows some very clever uses of OpenLayers. For some of these applications, one might have first thought of other technologies like Flash, but as we can see, the light-weight OpenLayers library really does the business good.

mercredi 27 mai 2009

Talend Case Studies

Talend is a powerful data integration opensource software.
The offical website includes a section with some clear, printscreened tutorials that let you explore the major functionalities.
The PDF documentations: user and components reference guide (in french and english) are really complete.
In the components reference guide, you'll find scenarios for each component.
Also, some webinars are animated live during which some Talend users from different organizations (public, private) explain how they use Talend. The webinars are still accessible in the webinar archives part.

Like for every software, the best thing is to practice. To approach all the software's potentials or even to figure out what could be processed, case studies are really helpful. So, it's a good news Talend published a case studies PDF. You'll probably find it useful to see how organizations used Talend in some ambitious business intelligence projects where data integration and orchestration were some prerequisites.
http://www.talend.com/document-download.php?doc=practosdi2fr&src=AdDeveloppez_may09

vendredi 15 mai 2009

From GIS File Management to DataBase Management with PostgreSQL/PostGIS

One goal of data Integration is to collect data from an organization into a single location.
One common difficulty for the data integrator is the spread of data that makes it difficult to locate.
Another one is to keep the data structure and unicity, even when data is centralized.

PostGIS/PostgreSQL is a very interesting and convenient datawarehouse for hosting an organization's pool of geographic Data:
-Fist of all, it is opensource, very well-documented.
-It takes advantage of the contributions of a growing community; PostGIS will soon support raster with the WKTRaster project.
-When you access PostGIS files through applications like QGIS, you guarantee the user a quick access to data; you can prevent him from modifying the data structure like the names, the types of the fields : this way, it maintains your data quality
-Automatic Processes can be performed on the server-side thanks to triggers. It's useful for historization : imagine automatically adding the current date, the user name when inserting / updating data.
-Roles and permissions are easily manageable and more fine-grained and versatile than ACL rights on a server. Whereas server's ACLs only allow you to give or revoke permissions on accessing/reading/writing a file, with PostgreSQL, you can grant privileges on reading (viewing), inserting, updating and deleting values.

All these elements contribute in easing Data Management, ensuring its quality.

Let's consider I managed to gather a tremendous quantity of geographic files in a set of folders ,now the question is: how to migrate my data into my PostgreSQL/PostGIS Database?
Assuming a database is equivalent to a folder and a database table to a GIS File, I'd like to get a database structure which would be as compliant as possible with the initial folder tree structure.

In the next posts, I'll detail two ways to get our database "skeleton", each one leaning on a delimited file with the databases' names. The first way uses a DOS Batch File, the second the ETL (Extract, Transform and Load) software Spatial Data Integrator.

PS: you can transform GIS Files into PostGIS tables, but it's also reversible: you can convert PostGIS Tables into GIS Files.

dimanche 26 avril 2009

QGIS routine: get the attribute values of selected features

Here, we'll learn how to access the values of a layer's selected features.

The retrieval of these values deserves many uses:
Statistics:
-some aggregation operations like sum, average, whatever...

Actions:
-Opening a picture related to a ponctual object
-Opening a web browser which URL includes one or more attribute values

Outputs:
-Export the values of selected features in a PDF report
-Opening a spreadsheet with these values so as to make graphs.

Notice: most of the actions mentionned above can also be accomplished using the QGIS actions that you access through the layer's properties.

Here is the QGIS routine that will allow you to access the attribute values of the active layer's selected features:

>>> myLayer=iface.activeLayer()
>>> objects=myLayer.selectedFeatures()
>>> objets.attributeMap()
>>> object=objects[0]
>>> attributes=object.attributeMap()
>>> attributes[0].toString()
"Bonifacio"

>>> objects=myLayer.selectedFeatures()
it returns a list of the selected objects
>>> attributes=object.attributeMap()
This attributeMap() method allows you to get the attribute values of the object you considered, in our case, the first one (object=object[0]).
It returns a dictionary which each key is an auto-incremented number. Notice that, unfortunately, the key is not the attribute name.
>>> attributes[0].toString()
Each value of the attributes is QString object. The method toString() makes it readable for the user. Here, we get the the first attribute's value.

Most often, you would combine the previous "attribute name" routine with this one.

mercredi 1 avril 2009

QGIS routine-get the fields!

Imagine you'd like to create a plugin that searches objects depending on their attributes.You'd like to display the layer fields in a combobox but how to get them?

The code shown below is often used in plugins and allows you to get the curent layer's fields.
mc=iface.getMapCanvas()
layer=mc.currentLayer()
provider=layer.getDataProvider()
fieldmap=provider.fields()
fieldmap is a list of values containing your field names.
If you want to get the name of the ith field, just type fieldmap[i] in the QGIS python console.
Maybe now you've learned how to get the layer fields, you'd like to know their values. It'll be the purpose of the next post.

first QGIS routine: get some layers


Get the current layer


Often, you'll have to perform operations on the active layer.
Before performing these operations, you first have to identify it and get it.
Once you have it, you can perform all the operations you'll want.
In the following lines, i've included print statements so as to check the content of my variables.

>>>mc=iface.getMapCanvas()
>>> mycurrentlayer=mc.currentLayer()
>>> print mycurrentlayer.getLayerID()
lakes20090310215511168
>>> print mycurrentlayer.name()
lakes

Firts of all, put the canvas in the variable mc.
>>>mc=iface.getMapCanvas()
Once you have your canvas, get its current layer called mycurrentlayer.
>>> mycurrentlayer=mc.currentLayer()

You can see some methods have been applied to the layer:
  • the method getLayerID()
  • the method name()
The layer name is only useful when displayed.
The layer id is often used whe performing operations on the layer.

Get a layer according according to its position in the legend

>>> mc=iface.getMapCanvas()
>>> myfirstlayer=mc.getZpos(1)

The method getZpos allows you to get a layer according to its position in the legend.

This kind of routine is often used when you need to get layers with their indexes

QGIS python console-Note-before beginning...

When coding QGIS plugins, you'll have to deal with objects such as the interface (iface object), the canvas, the layers of course. Each object has a certain number of attributes and methods. For example, layers have the attribute "source", or "name". They also are assigned methods like the "getSelectedFeatures" method. Notice that when applying the function "getSelectedFeatures", you get some feature objects. Like interface, canvas and layer, features are another type of object with attributes and methods. Of course, I won't list all the objects, attributes and methods avalaible through the QGIS API.

Another aspect is the notion of inheritance: the classes QgsVectorLayer and QgsRasterLayer are like brother objects, who have a common parent: the QgsMapLayer Class. They are both specific and contain different methods but what they have in common are the attributes and methods of their parent class: QgsMapLayer.

This API reflects a contemporary vision in programming called object oriented programming. All the programming books deal with this subject.

What I recommend you while reading the examples posts is having the API doc opened in your web navigator, so that you check the function, object properties I'm calling.

Let's remind you the QGIS API address:
http://doc.qgis.org/
On the website, choose your version. Most of the times, it is the kore version...

QGIS-Using the python console

As previously said, the QGIS python console is a good way to test step by step your code before implementing it to your plugin...

To access the python console, just go to plugins > python console.


Notice the example instruction in the shell iface.zoomFull(): this command is applied on the interface object called iface. It performs a zoom that makes all your objects visible.
Just try typing it in the shell to see the result:

The QGIS console is similar to a python shell but there are some limitations like the impossibility of writing multiples lines of code in one time,as it is possible with the usual python shell.

Usually, the "for" and "while" statements require multiples lines. They are often used to get lists. As the "for" and "while" statements are unavalaible, you'll have to deal with the notion of list comprehension to get a list of values.
Look at these links to learn how to use them:
http://docs.python.org/tutorial/datastructures.html
http://www.secnetix.de/olli/Python/list_comprehensions.hawk
In the examples i'll show you in the next posts, you'll see some examples of these notions.

You can also have to use map, filter, and reduce functions, that are used on lists:
http://docs.python.org/library/functions.html

To write functions, you'll have to get familiar with lambda function...
http://www.secnetix.de/olli/Python/lambda_functions.hawk

(2/3) Comparaison GvSIG/QGIS: réalisation d'une mise en page

Cette fiche met face à face nos deux logiciels dans la réalisation d'une mise en page nécessitant l'insertion d'une carte, d'un titre, d'une légende, d'une barre d'échelle ainsi que d'une image. Sont également abordés la configuration de l'impression de même que l'export: PDF ou image.

Cliquez ici pour y accéder (la fiche a été publiée sur le site scribd.com)

(1/3) Comparaison GvSIG/QGIS: accès à l'information, lecture

Cette fiche met face à face nos deux logiciels dans l'accomplissement de ces tâches:
-ouverture d'une couche
-requêtes
-lecture des données attributaires
-étiquetage
-analyse thématique
-...

Cliquez ici pour y accéder (la fiche a été publiée sur le site scribd.com)

GvSIG et QGIS

Dans le cadre de mon travail, nous nous sommes intéressés principalement à deux solutions SIG opensource pouvant combler les besoins d'un niveau d'utilisation intermédiaire. Il s'agit de GvSIG et QGIS.

J'ai décidé de rédiger des fiches comparatives de ces deux outils dans ce contexte d'utilisation (pour rappel, consultation des données, réalisation de requêtes simples, alimentation des bases de données géographiques, mais pas pour autant création de nouvelles).

-La première fiche confronte ces deux logiciels dans l'accès à l'information géographique, la réalisation de requêtes.
-La deuxième fiche concerne la mise en page de cartes.
-La dernière fiche concerne la production de données géographiques.

Dans ces fiches, des copies d'écran de chaque outil mises face à face vous permettront d'apprécier l'esthétique, l'ergonomie ainsi que le niveau de fonctionnalités pour chaque opération.

Aucun commentaire n'accompagne ces copies d'écran. Je projette d'en inclure dans des versions futures de ces documents. Cela dit, l'absence de commentaires vous permettra de vous faire une idée par vous-mêmes.

Bonne lecture!

Catégories d'utilisateurs-Outils OpenSource

Avant de vouloir étendre l'utilisation des outils SIG au sein d'une structure, il est important de dissocier différentes catégories d'utilisateurs suivant leurs besoins. Ceci afin de faire correspondre à chacune un outil, voire une technologie d'accès à l'information géographique.

Je propose ici une classification des utilisateurs en trois catégories. Cette dissociation est personnelle, et est bien sûr sujette à discussion.

Du niveau le plus élémentaire au niveau le plus avancé:
-la première représente l'utilisateur dont le seul accès à l'information géographique suffit. Son besoin de navigation, d'accès à l'information est basique et doit être instantané, le plus rapide possible. Les clients légers basés sur des technologies de serveur cartographique correspondent à ce niveau d'utilisation. Comme on peut estimer que tout un chacun s'est déjà servi de google maps, via michelin, ou mappy, on peut considérer qu'un utilisateur lambda peut correspondre à cette catégorie.

-la deuxième correspond à l'utilisateur dont le SIG est une composante importante de son métier. Le SIG l'aide dans ses décisions et il est amené à présenter des cartes à divers partenaires, lors de réunions. Il peut aussi alimenter des bases de données sans pour autant devoir en créer. C'est un utilisateur de technicité supérieure assez autonome dans la réalisation de travaux cartographiques. Contrairement à l'utilisateur de la catégorie précédente, il aura besoin d'une formation initiale avant d'atteindre ce niveau de compétences. On observe souvent que des solutions propriétaires sont utilisées par ces agents alors que des solutions issues du monde libre satisfont amplement ce niveau d'utilisation (voire peut-être trop?).

-La troisième concerne l'utilisateur dont le SIG est un outil du quotidien dont l'utilisation représente plus de la moitié des activités. Il crée des bases de données pour les agents, réalise des requêtes complexes, par exemple à des fins statistiques. Il est référent au sein de son service, voire de la structure. Des logiciels du monde libre peuvent satisfaire ses besoins tels UDig, QGIS, GRASS mais il utilise généralement des solutions propriétaires. MapInfo, ArcView sont souvent ses outils de travail.

La deuxième catégorie d'utilisateur est une catégorie cible si l'on souhaite intégrer la dimension géographique au sein d'une structure. Il s'agit, progressivement, d'amener les agents de niveau d'utilisation faible vers ce niveau intermédiaire. Le coût de cette migration est financièrement nul dans la mesure où l'on a affecté à cette catégorie l'utilisation de logiciels opensource.

mardi 17 mars 2009

What's the power of an opensource GIS software as QGIS in an organization?

Sometimes, GIS applications are too sophisticated for standard users.
For example, in the organization in which i work, we would like to develop the use of GIS applications, expand its use. However, we know that a very small percentage of the GIS application functionalities will actually be used.

The main reason is that the users' activities don't necessarily require knowing a large panel of the app functionnalities. Another reason is that their part-time activities don't allow them to devote too much time learning advanced features or performing complex operations.

One solution is to deploy simplified applications that will concentrate the major functionnalities the user needs.
Another one is to implement functions in existing GIS applications that ease the execution of complex operations.

For all of these problematics, opensource GIS softwares are the solution, insofar as we can shape them according to the user's needs...

To develop simplified applications, we have different opensource solutions, the most-known of them being the use of QGIS API. There also are Mapnik and other softwares...
With QGIS API, you can integrate plugins to QGIS that will be executed through buttons in the interface menu. Developing QGIS plugins is kind of developing on MapBasic for MapInfo.

When you develop, either applications, either plugins, you use the QGIS Python modules from the QGIS API library in your program...
For example, some functions of these modules allow you to get information about the loaded layers, like the projection system reference. They also allow you to perform tasks like zooming, adding layers, coordinate reference system transforming
Thus, you can execute a series of operations...

There are good links on the web that will teach you how to develop standalone applications and plugins. I listed them at the end of this post

A good way to get familiarized with the QGIS API python library is to use the python console included in the QGIS application...

The purpose of the next post is to teach you some QGIS API python routines that you'll use on the QGIS python console.

Actually, using the python console can be really helpful when you'll be preparing your standalone application or plugin code...

Developing in python language is a really good thing, as python is a re-known programming language, even used in web applications, like the powerful Content Management Systems ZOPE, or like web frameworks Django and Pylons...

================================
Links:
From the QGIS wiki:
http://wiki.qgis.org/qgiswiki/DevelopingPluginsWithPython (plugins)
http://wiki.qgis.org/qgiswiki/PythonBindings (standalone app)

From the QGIS Blog
http://blog.qgis.org/?q=node/29 (standalone app)
http://blog.qgis.org/taxonomy/term/2 (both)
http://blog.qgis.org/?q=node/104 (plugin)
http://blog.qgis.org/?q=node/59 (standalone app)

Other Websites:
http://softlibre.gloobe.org/doku.php/qgis/workshop/plugin (plugin)
http://www.duif.net/qgis/ (plugin)
http://desktopgisbook.com/Creating_a_Standalone_GIS_Application_1 (standalone)