Here, we'll learn how to access the values of a layer's selected features.
The retrieval of these values deserves many uses:
Statistics:
-some aggregation operations like sum, average, whatever...
Actions:
-Opening a picture related to a ponctual object
-Opening a web browser which URL includes one or more attribute values
Outputs:
-Export the values of selected features in a PDF report
-Opening a spreadsheet with these values so as to make graphs.
Notice: most of the actions mentionned above can also be accomplished using the QGIS actions that you access through the layer's properties.
Here is the QGIS routine that will allow you to access the attribute values of the active layer's selected features:
>>> myLayer=iface.activeLayer()
>>> objects=myLayer.selectedFeatures()
>>> objets.attributeMap()
>>> object=objects[0]
>>> attributes=object.attributeMap()
>>> attributes[0].toString()
"Bonifacio"
>>> objects=myLayer.selectedFeatures()
it returns a list of the selected objects
>>> attributes=object.attributeMap()
This attributeMap() method allows you to get the attribute values of the object you considered, in our case, the first one (object=object[0]).
It returns a dictionary which each key is an auto-incremented number. Notice that, unfortunately, the key is not the attribute name.
>>> attributes[0].toString()
Each value of the attributes is QString object. The method toString() makes it readable for the user. Here, we get the the first attribute's value.
Most often, you would combine the previous "attribute name" routine with this one.

dimanche 26 avril 2009
mercredi 1 avril 2009
QGIS routine-get the fields!
Imagine you'd like to create a plugin that searches objects depending on their attributes.You'd like to display the layer fields in a combobox but how to get them?
The code shown below is often used in plugins and allows you to get the curent layer's fields.
mc=iface.getMapCanvas()
layer=mc.currentLayer()
provider=layer.getDataProvider()
fieldmap=provider.fields()
The code shown below is often used in plugins and allows you to get the curent layer's fields.
mc=iface.getMapCanvas()
layer=mc.currentLayer()
provider=layer.getDataProvider()
fieldmap=provider.fields()
fieldmap is a list of values containing your field names.
If you want to get the name of the ith field, just type fieldmap[i] in the QGIS python console.
Maybe now you've learned how to get the layer fields, you'd like to know their values. It'll be the purpose of the next post.
first QGIS routine: get some layers
Get the current layer
Often, you'll have to perform operations on the active layer.
Before performing these operations, you first have to identify it and get it.
Once you have it, you can perform all the operations you'll want.
In the following lines, i've included print statements so as to check the content of my variables.
>>>mc=iface.getMapCanvas()
>>> mycurrentlayer=mc.currentLayer()
>>> print mycurrentlayer.getLayerID()
lakes20090310215511168
>>> print mycurrentlayer.name()
lakes
Firts of all, put the canvas in the variable mc.
>>>mc=iface.getMapCanvas()
Once you have your canvas, get its current layer called mycurrentlayer.
>>> mycurrentlayer=mc.currentLayer()
You can see some methods have been applied to the layer:
- the method getLayerID()
- the method name()
The layer id is often used whe performing operations on the layer.
Get a layer according according to its position in the legend
>>> mc=iface.getMapCanvas()
>>> myfirstlayer=mc.getZpos(1)
The method getZpos allows you to get a layer according to its position in the legend.
This kind of routine is often used when you need to get layers with their indexes
QGIS python console-Note-before beginning...
When coding QGIS plugins, you'll have to deal with objects such as the interface (iface object), the canvas, the layers of course. Each object has a certain number of attributes and methods. For example, layers have the attribute "source", or "name". They also are assigned methods like the "getSelectedFeatures" method. Notice that when applying the function "getSelectedFeatures", you get some feature objects. Like interface, canvas and layer, features are another type of object with attributes and methods. Of course, I won't list all the objects, attributes and methods avalaible through the QGIS API.
Another aspect is the notion of inheritance: the classes QgsVectorLayer and QgsRasterLayer are like brother objects, who have a common parent: the QgsMapLayer Class. They are both specific and contain different methods but what they have in common are the attributes and methods of their parent class: QgsMapLayer.
This API reflects a contemporary vision in programming called object oriented programming. All the programming books deal with this subject.
What I recommend you while reading the examples posts is having the API doc opened in your web navigator, so that you check the function, object properties I'm calling.
Let's remind you the QGIS API address:
http://doc.qgis.org/
On the website, choose your version. Most of the times, it is the kore version...
QGIS-Using the python console
As previously said, the QGIS python console is a good way to test step by step your code before implementing it to your plugin...
To access the python console, just go to plugins > python console.

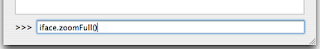
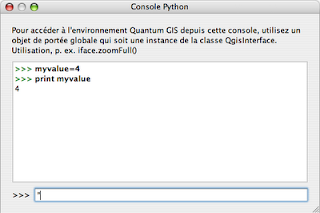 Notice the example instruction in the shell iface.zoomFull(): this command is applied on the interface object called iface. It performs a zoom that makes all your objects visible.
Just try typing it in the shell to see the result:
The QGIS console is similar to a python shell but there are some limitations like the impossibility of writing multiples lines of code in one time,as it is possible with the usual python shell.
Usually, the "for" and "while" statements require multiples lines. They are often used to get lists. As the "for" and "while" statements are unavalaible, you'll have to deal with the notion of list comprehension to get a list of values.
Look at these links to learn how to use them:
http://docs.python.org/tutorial/datastructures.html
http://www.secnetix.de/olli/Python/list_comprehensions.hawk
In the examples i'll show you in the next posts, you'll see some examples of these notions.
You can also have to use map, filter, and reduce functions, that are used on lists:
http://docs.python.org/library/functions.html
To write functions, you'll have to get familiar with lambda function...
http://www.secnetix.de/olli/Python/lambda_functions.hawk
To access the python console, just go to plugins > python console.

 Notice the example instruction in the shell iface.zoomFull(): this command is applied on the interface object called iface. It performs a zoom that makes all your objects visible.
Just try typing it in the shell to see the result:

The QGIS console is similar to a python shell but there are some limitations like the impossibility of writing multiples lines of code in one time,as it is possible with the usual python shell.
Usually, the "for" and "while" statements require multiples lines. They are often used to get lists. As the "for" and "while" statements are unavalaible, you'll have to deal with the notion of list comprehension to get a list of values.
Look at these links to learn how to use them:
http://docs.python.org/tutorial/datastructures.html
http://www.secnetix.de/olli/Python/list_comprehensions.hawk
In the examples i'll show you in the next posts, you'll see some examples of these notions.
You can also have to use map, filter, and reduce functions, that are used on lists:
http://docs.python.org/library/functions.html
To write functions, you'll have to get familiar with lambda function...
http://www.secnetix.de/olli/Python/lambda_functions.hawk
(2/3) Comparaison GvSIG/QGIS: réalisation d'une mise en page
Cette fiche met face à face nos deux logiciels dans la réalisation d'une mise en page nécessitant l'insertion d'une carte, d'un titre, d'une légende, d'une barre d'échelle ainsi que d'une image. Sont également abordés la configuration de l'impression de même que l'export: PDF ou image.
Cliquez ici pour y accéder (la fiche a été publiée sur le site scribd.com)
Cliquez ici pour y accéder (la fiche a été publiée sur le site scribd.com)
(1/3) Comparaison GvSIG/QGIS: accès à l'information, lecture
Cette fiche met face à face nos deux logiciels dans l'accomplissement de ces tâches:
-ouverture d'une couche
-requêtes
-lecture des données attributaires
-étiquetage
-analyse thématique
-...
Cliquez ici pour y accéder (la fiche a été publiée sur le site scribd.com)
-ouverture d'une couche
-requêtes
-lecture des données attributaires
-étiquetage
-analyse thématique
-...
Cliquez ici pour y accéder (la fiche a été publiée sur le site scribd.com)
GvSIG et QGIS
Dans le cadre de mon travail, nous nous sommes intéressés principalement à deux solutions SIG opensource pouvant combler les besoins d'un niveau d'utilisation intermédiaire. Il s'agit de GvSIG et QGIS.
J'ai décidé de rédiger des fiches comparatives de ces deux outils dans ce contexte d'utilisation (pour rappel, consultation des données, réalisation de requêtes simples, alimentation des bases de données géographiques, mais pas pour autant création de nouvelles).
-La première fiche confronte ces deux logiciels dans l'accès à l'information géographique, la réalisation de requêtes.
-La deuxième fiche concerne la mise en page de cartes.
-La dernière fiche concerne la production de données géographiques.
Dans ces fiches, des copies d'écran de chaque outil mises face à face vous permettront d'apprécier l'esthétique, l'ergonomie ainsi que le niveau de fonctionnalités pour chaque opération.
Aucun commentaire n'accompagne ces copies d'écran. Je projette d'en inclure dans des versions futures de ces documents. Cela dit, l'absence de commentaires vous permettra de vous faire une idée par vous-mêmes.
Bonne lecture!
Catégories d'utilisateurs-Outils OpenSource
Avant de vouloir étendre l'utilisation des outils SIG au sein d'une structure, il est important de dissocier différentes catégories d'utilisateurs suivant leurs besoins. Ceci afin de faire correspondre à chacune un outil, voire une technologie d'accès à l'information géographique.
Je propose ici une classification des utilisateurs en trois catégories. Cette dissociation est personnelle, et est bien sûr sujette à discussion.
Du niveau le plus élémentaire au niveau le plus avancé:
-la première représente l'utilisateur dont le seul accès à l'information géographique suffit. Son besoin de navigation, d'accès à l'information est basique et doit être instantané, le plus rapide possible. Les clients légers basés sur des technologies de serveur cartographique correspondent à ce niveau d'utilisation. Comme on peut estimer que tout un chacun s'est déjà servi de google maps, via michelin, ou mappy, on peut considérer qu'un utilisateur lambda peut correspondre à cette catégorie.
-la deuxième correspond à l'utilisateur dont le SIG est une composante importante de son métier. Le SIG l'aide dans ses décisions et il est amené à présenter des cartes à divers partenaires, lors de réunions. Il peut aussi alimenter des bases de données sans pour autant devoir en créer. C'est un utilisateur de technicité supérieure assez autonome dans la réalisation de travaux cartographiques. Contrairement à l'utilisateur de la catégorie précédente, il aura besoin d'une formation initiale avant d'atteindre ce niveau de compétences. On observe souvent que des solutions propriétaires sont utilisées par ces agents alors que des solutions issues du monde libre satisfont amplement ce niveau d'utilisation (voire peut-être trop?).
-La troisième concerne l'utilisateur dont le SIG est un outil du quotidien dont l'utilisation représente plus de la moitié des activités. Il crée des bases de données pour les agents, réalise des requêtes complexes, par exemple à des fins statistiques. Il est référent au sein de son service, voire de la structure. Des logiciels du monde libre peuvent satisfaire ses besoins tels UDig, QGIS, GRASS mais il utilise généralement des solutions propriétaires. MapInfo, ArcView sont souvent ses outils de travail.
La deuxième catégorie d'utilisateur est une catégorie cible si l'on souhaite intégrer la dimension géographique au sein d'une structure. Il s'agit, progressivement, d'amener les agents de niveau d'utilisation faible vers ce niveau intermédiaire. Le coût de cette migration est financièrement nul dans la mesure où l'on a affecté à cette catégorie l'utilisation de logiciels opensource.
Inscription à :
Articles (Atom)