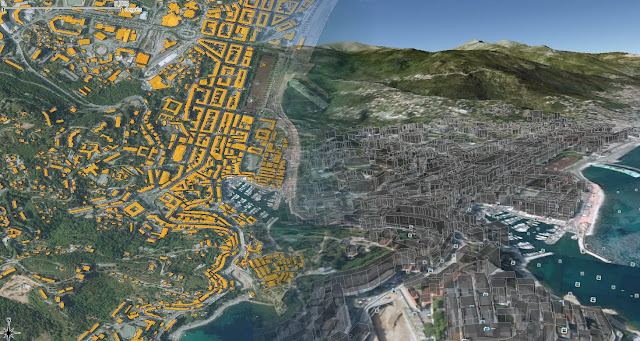
 As I discover the marvels of (geo)R world, I found out this article (link)
It explains how to generate KML files from meuse, the source dataset delivered with sp package, using R software.
In the tutorial, KML files are created from scracth, writing each line of it.OGR driver only gives access to the options name and description (rdgal driver). So, "brute coding" may be necessary if you want to control other elements: color, heights for extruded objects...
Many people would like to visualize some buildings in 3D in google. The reference data that we have for buildings is often plain but there usually is a column specifying the height of each building. For example, for the french BDTOPO, the HAUTEUR column.
On the web, I found an arcScript for this but no opensource pre-built script or software.
Reading the article of the above mentioned tutorial called ploting 3D points gave me the idea to develop an R script for this purpose - which wasn't so difficult, indeed.
Here is the complete script:
# import rgdal library which contains all necessary drivers
library(rgdal)


# shp import

buildings<-readOGR(dsn="C:/buildings.shp",layer="buildings")


#variable initialization

zColumn<-"HEIGHT"


filename<-"buildings.kml"


#header writing

write(paste("<?xml

version=\"1.0\" encoding=\"ISO-8859-1\" ?><kml

xmlns=\"http:#www.opengis.net/kml/2.2\"><Document><Folder><name>buildingsge</name><Schema

name=\"buildingsge\" id=\"buildingsge\"></Schema>",

sep=""), filename)


#objects creation through a loop

for (x in 1:length(buildings@polygons)) {


write(paste("<Placemark><name>",

buildings@data$ID[x],

"</name><Style><LineStyle><color>7fbcbcbc</color></LineStyle><PolyStyle><color>7fbcbcbc</color></PolyStyle></Style><ExtendedData><SchemaData

schemaUrl=\"#buildingsge\"><SimpleData name=\"nature\">",

buildings@data$NATURE[x],"</SimpleData></SchemaData></ExtendedData><Polygon><extrude>1</extrude><altitudeMode>relativeToGround</altitudeMode><outerBoundaryIs><LinearRing><coordinates>",

sep=""), filename, append=TRUE)


# polygon coordinates injection

coordsPol<-paste(buildings@polygons[[x]]@Polygons[[1]]@coords[,1],

buildings@polygons[[x]]@Polygons[[1]]@coords[,2], buildings@data[[zColumn]][x],

sep=",")

write(coordsPol, filename, append=TRUE)


write("</coordinates></LinearRing></outerBoundaryIs></Polygon></Placemark>",filename,append=TRUE)}


# tail writing after exiting the loop

write("</Folder></Document></kml>",filename,append=TRUE)
Notes:
Here, I preferred to condense all the elements (<Placemark>, <coordinates>, etc...) in one line. Yet, it's not optimized for reading. One may prefer individualizing each line by as many write() occurrences as elements like in the spatial analyst tuto.
writing
is used to write the file from scratch
paste function
It's used in order to concatenate several string elements
Placemark name
buildings@data$ID[x]
Coordinates
buildings@polygons[[x]]@Polygons[[1]]@coords[,1]
buildings@polygons[[x]]@Polygons[[1]]@coords[,2]
buildings@data[[zColumn]][x]
Additional info
<ExtendedData<SchemaData schemaUrl=\"#buildingsge\">\" nature\">", buildings@data$NATURE[x],"
If you'd like to understand the functions of some KML elementsn check the KML reference guide:
http://code.google.com/intl/

Aucun commentaire:
Enregistrer un commentaire