
 Recently, a colleague of mine asked me if it was possible to generate mid-points for lines. The problem was that he had barrage data represented as lines and he wanted to see them on a map. So, getting the mid-point for these lines was a way to get the barrage location and put a symbol to each of it..
I searched the net and fell upon a gis stackexhange that mentionned a programming routine under python console
Also, an article by Martin laloux, a belgium GIS specialist could have been helpful to manage that.
These solutions could have been implemented under the form of a sextante toolbox function, or a plugin. But what if, like my colleague, you don't know how to code ? It's possible to generate mid-points from lines using QGIS plugins. Just follow the steps :
- Create a set of polylines

- Separate the lines from the polylines with the sextante QGIS algorithm "explode lines"

Add a unique identifier for every line with the calculator :


Extract the nodes

Add the geometry columns

Use group stats, applying average on both X and Y, then copy-paste the results in libreoffice. Save the file as csv


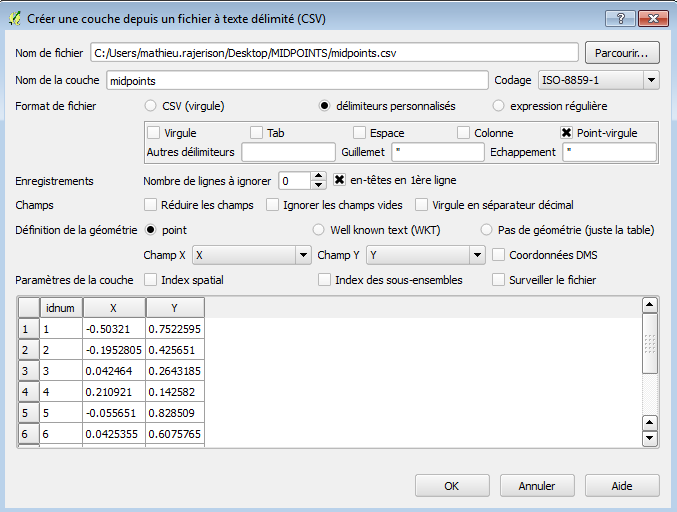
Add the csv as a spatial layer
Here we are !

Aucun commentaire:
Enregistrer un commentaire